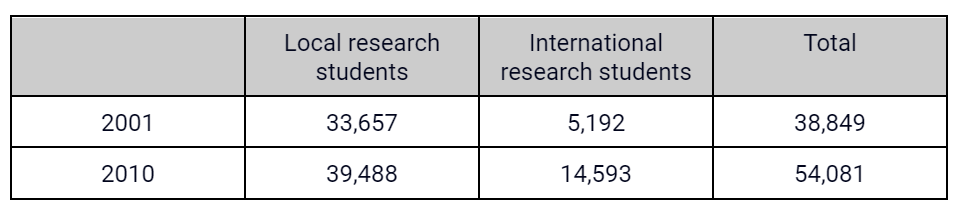
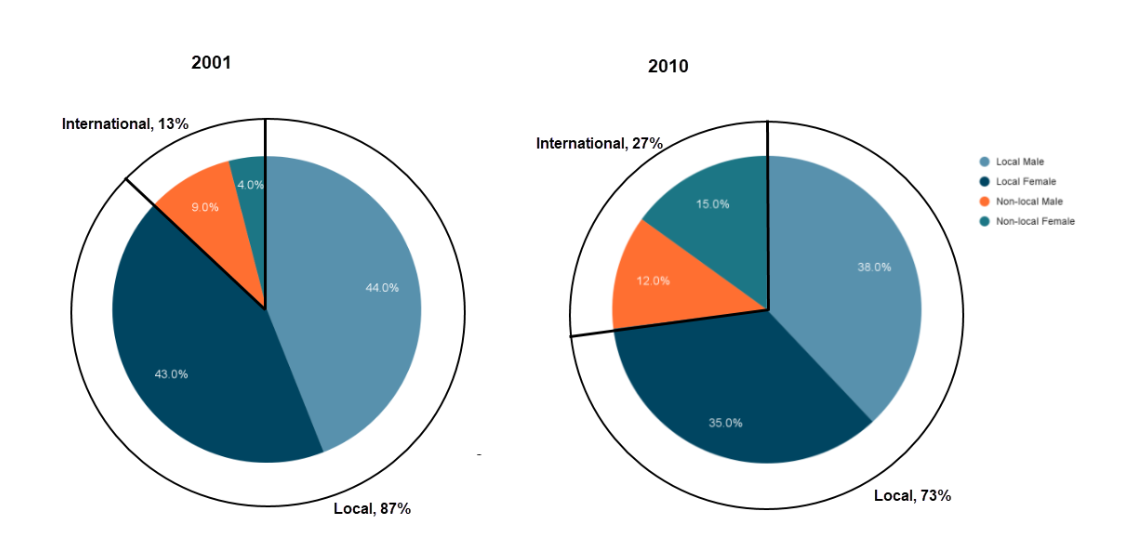
The table and pie charts below show the number of research students in Australian universities in 2001 and 2010.Summarise the information by selecting and reporting the main features, and make comparisons where relevant.
You should write at least 150 words.
Your Answer
Word Count: 0